Map Layers
Map Layers (Project Areas) are used to define spacial areas on the map so that comments are focused on the current Project Area.
To add a new layer or configure your existing Social Pinpoint layers (project areas)
-
Log in to your Social Pinpoint Admin site
-
Select edit on your project or create a new Project
-
In the tools panel on the left, select Map Editor
-
Follow the guide below to configure the various settings and options.
Log in to your Social Pinpoint Admin site
Select edit on your project or create a new Project
In the tools panel on the left, select Map Editor
Follow the guide below to configure the various settings and options.
Creating a New Map Layer
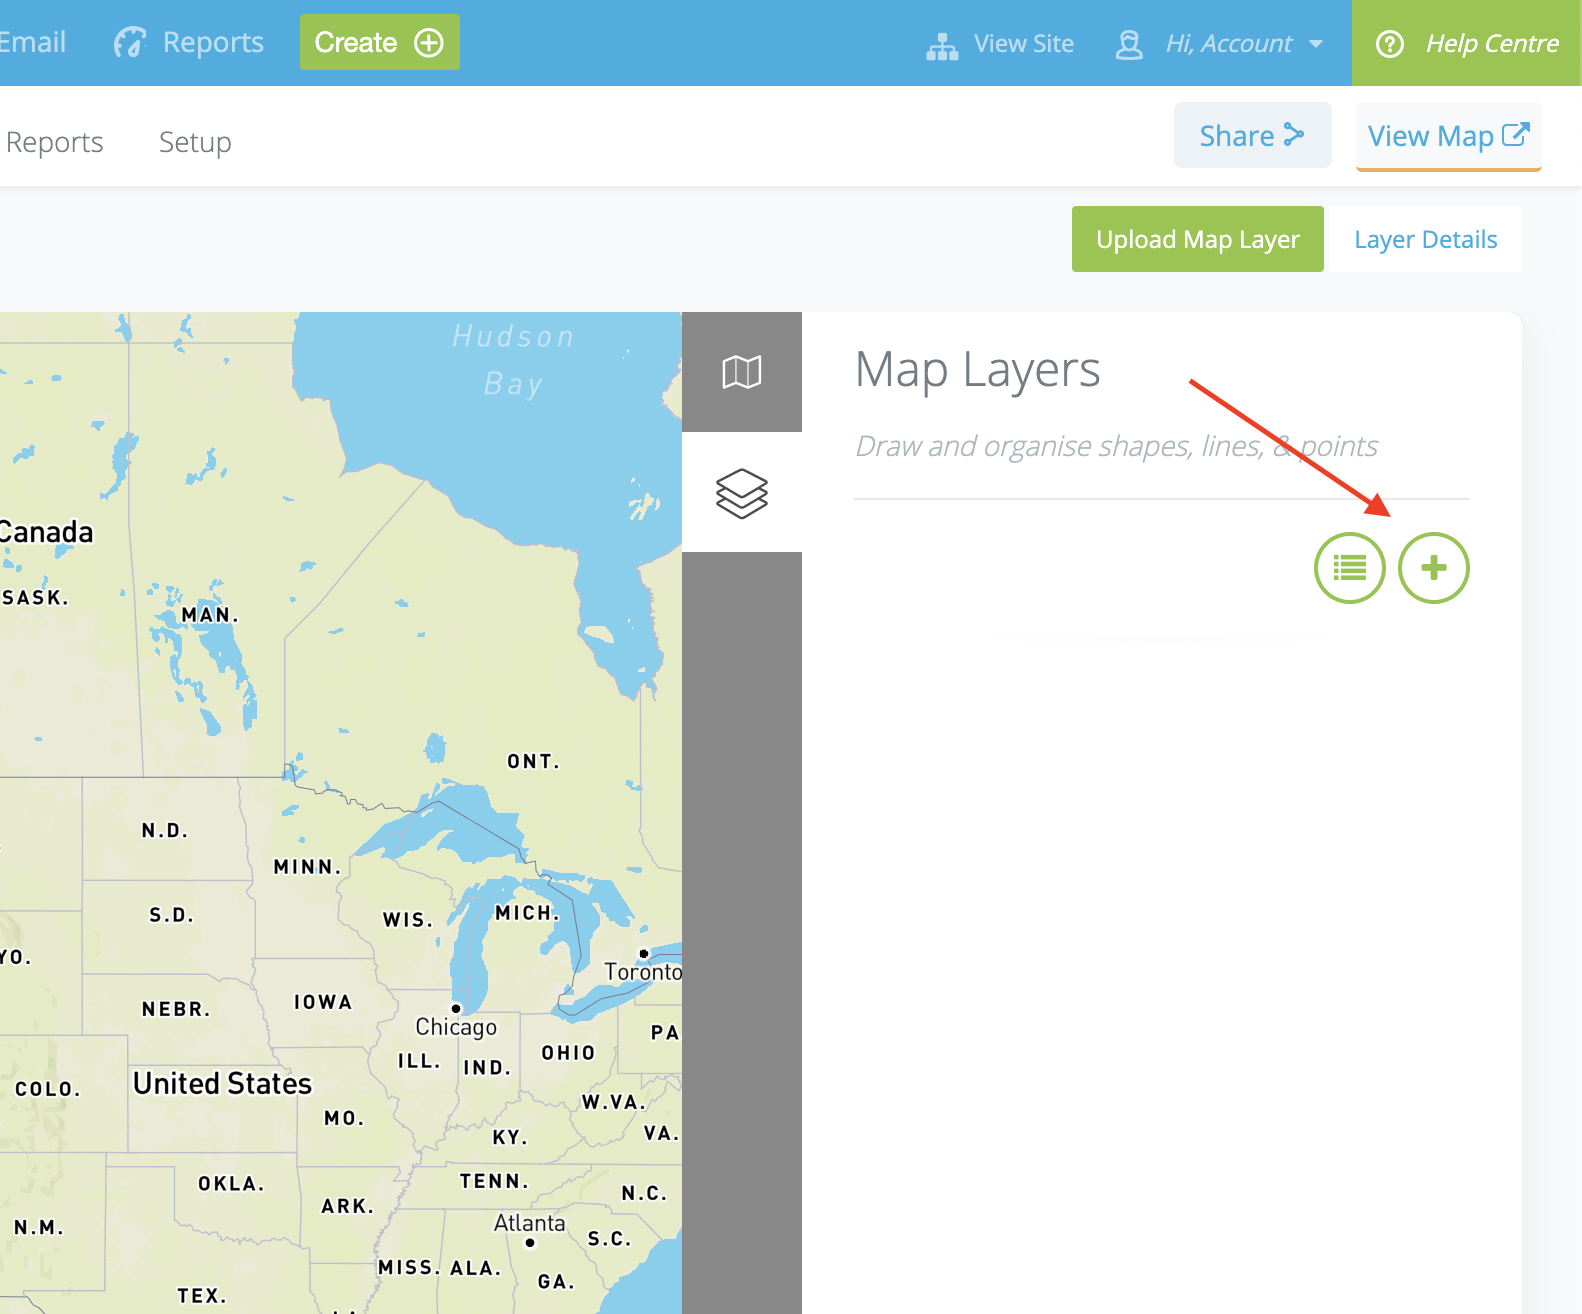
Click the green plus + to create a new Map Layer
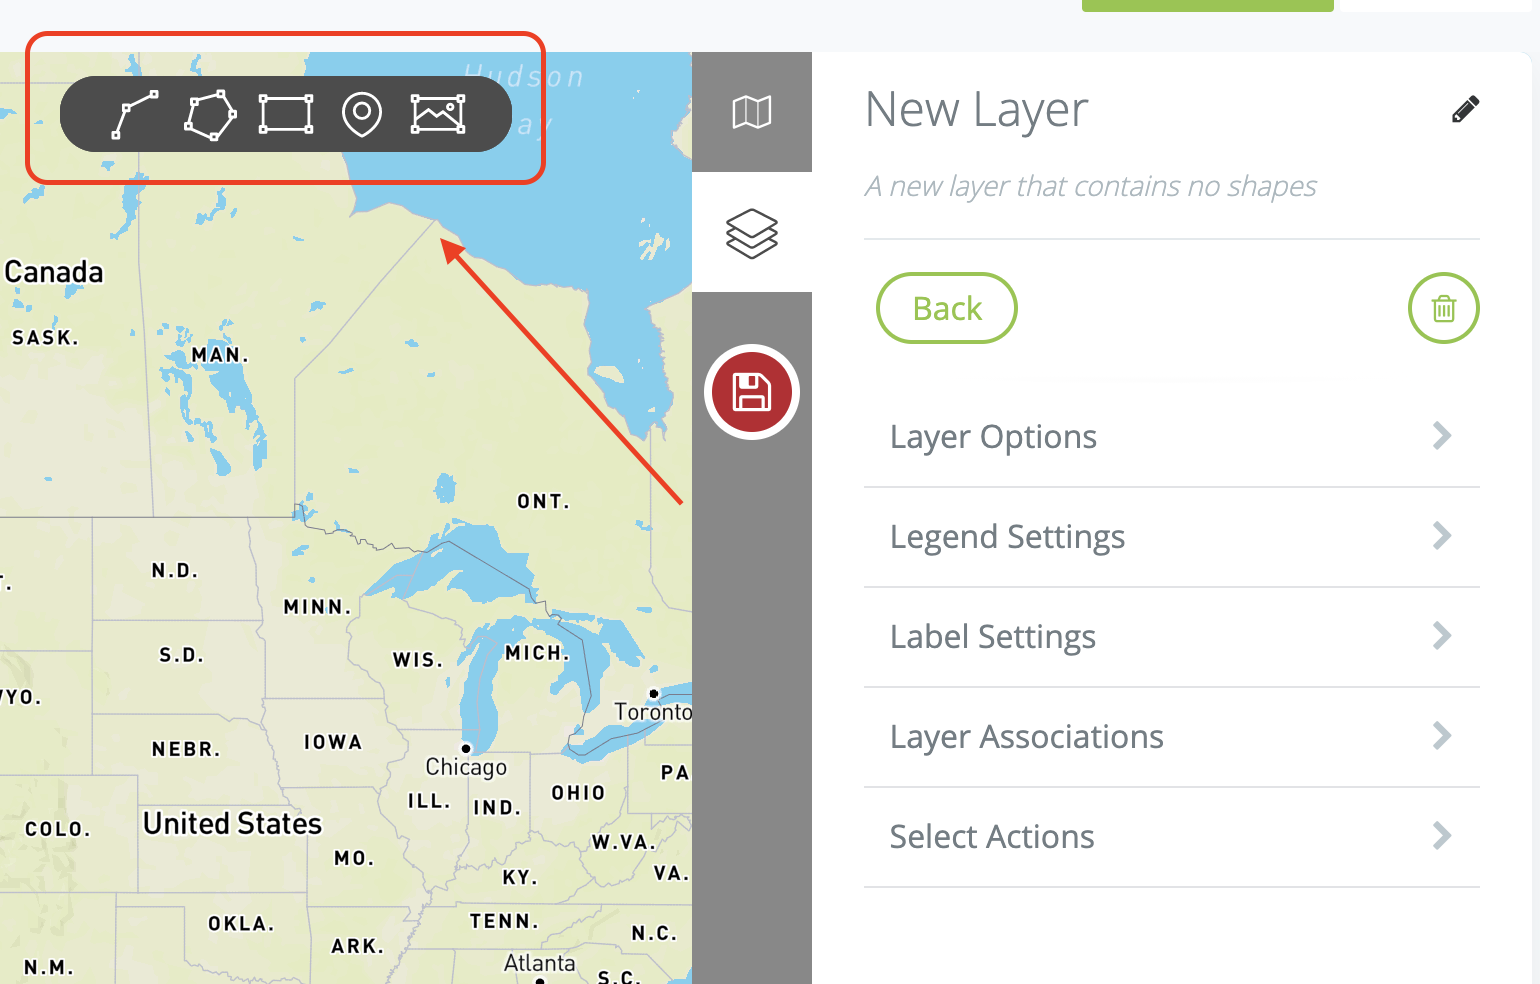
Choose the type of layer you would like to draw. You have the following options;
-
Line: This option would be good for representing roads or trails on the map
-
Polygon: This option would be good for representing boundaries or areas on the map
-
Square: This option is a quick way to draw a rectangle or square on your map
-
Point: This option allow you do represent one or multiple points on your map
-
Image: this option allows you to overlay an image file on your map
Line: This option would be good for representing roads or trails on the map
Polygon: This option would be good for representing boundaries or areas on the map
Square: This option is a quick way to draw a rectangle or square on your map
Point: This option allow you do represent one or multiple points on your map
Image: this option allows you to overlay an image file on your map
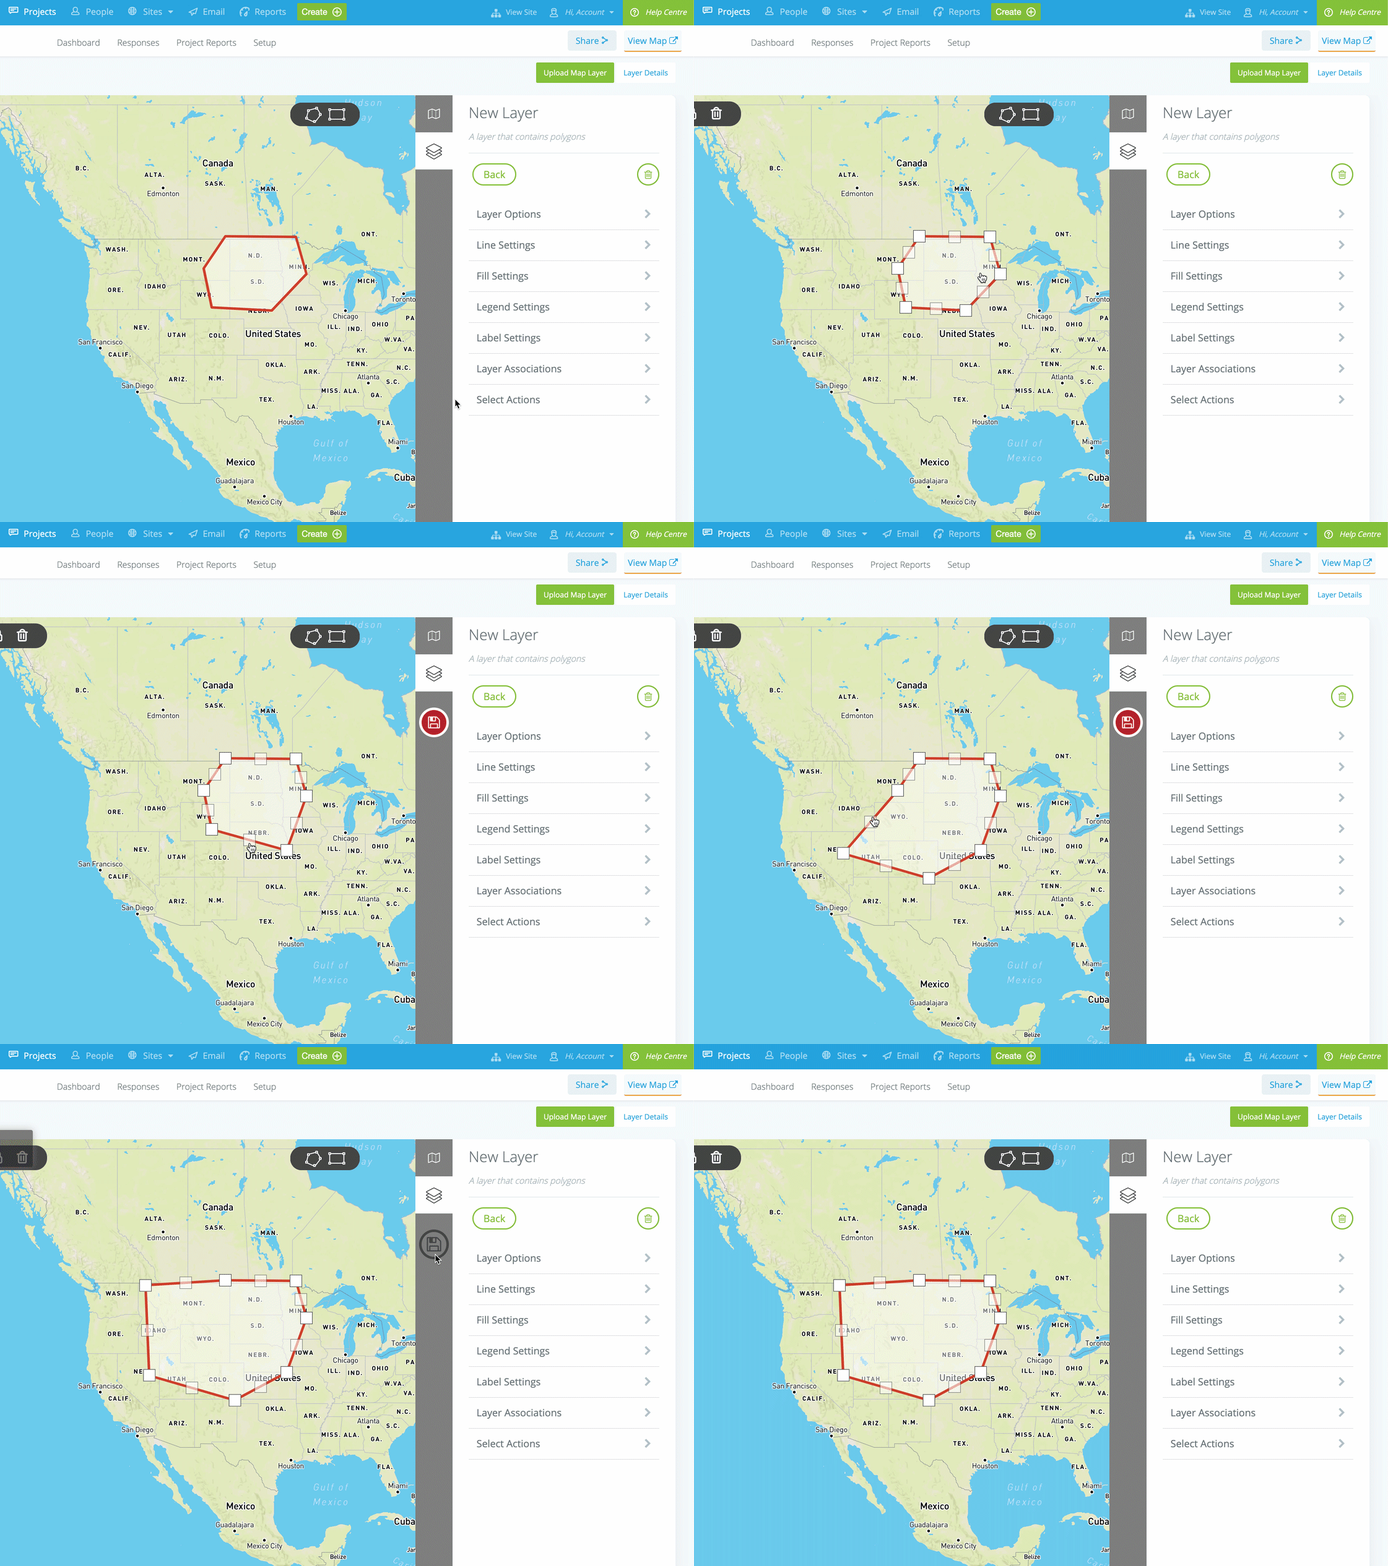
Once you have selected the type of layer you want to draw. You can click anywhere to begin drawing or placing your layer.
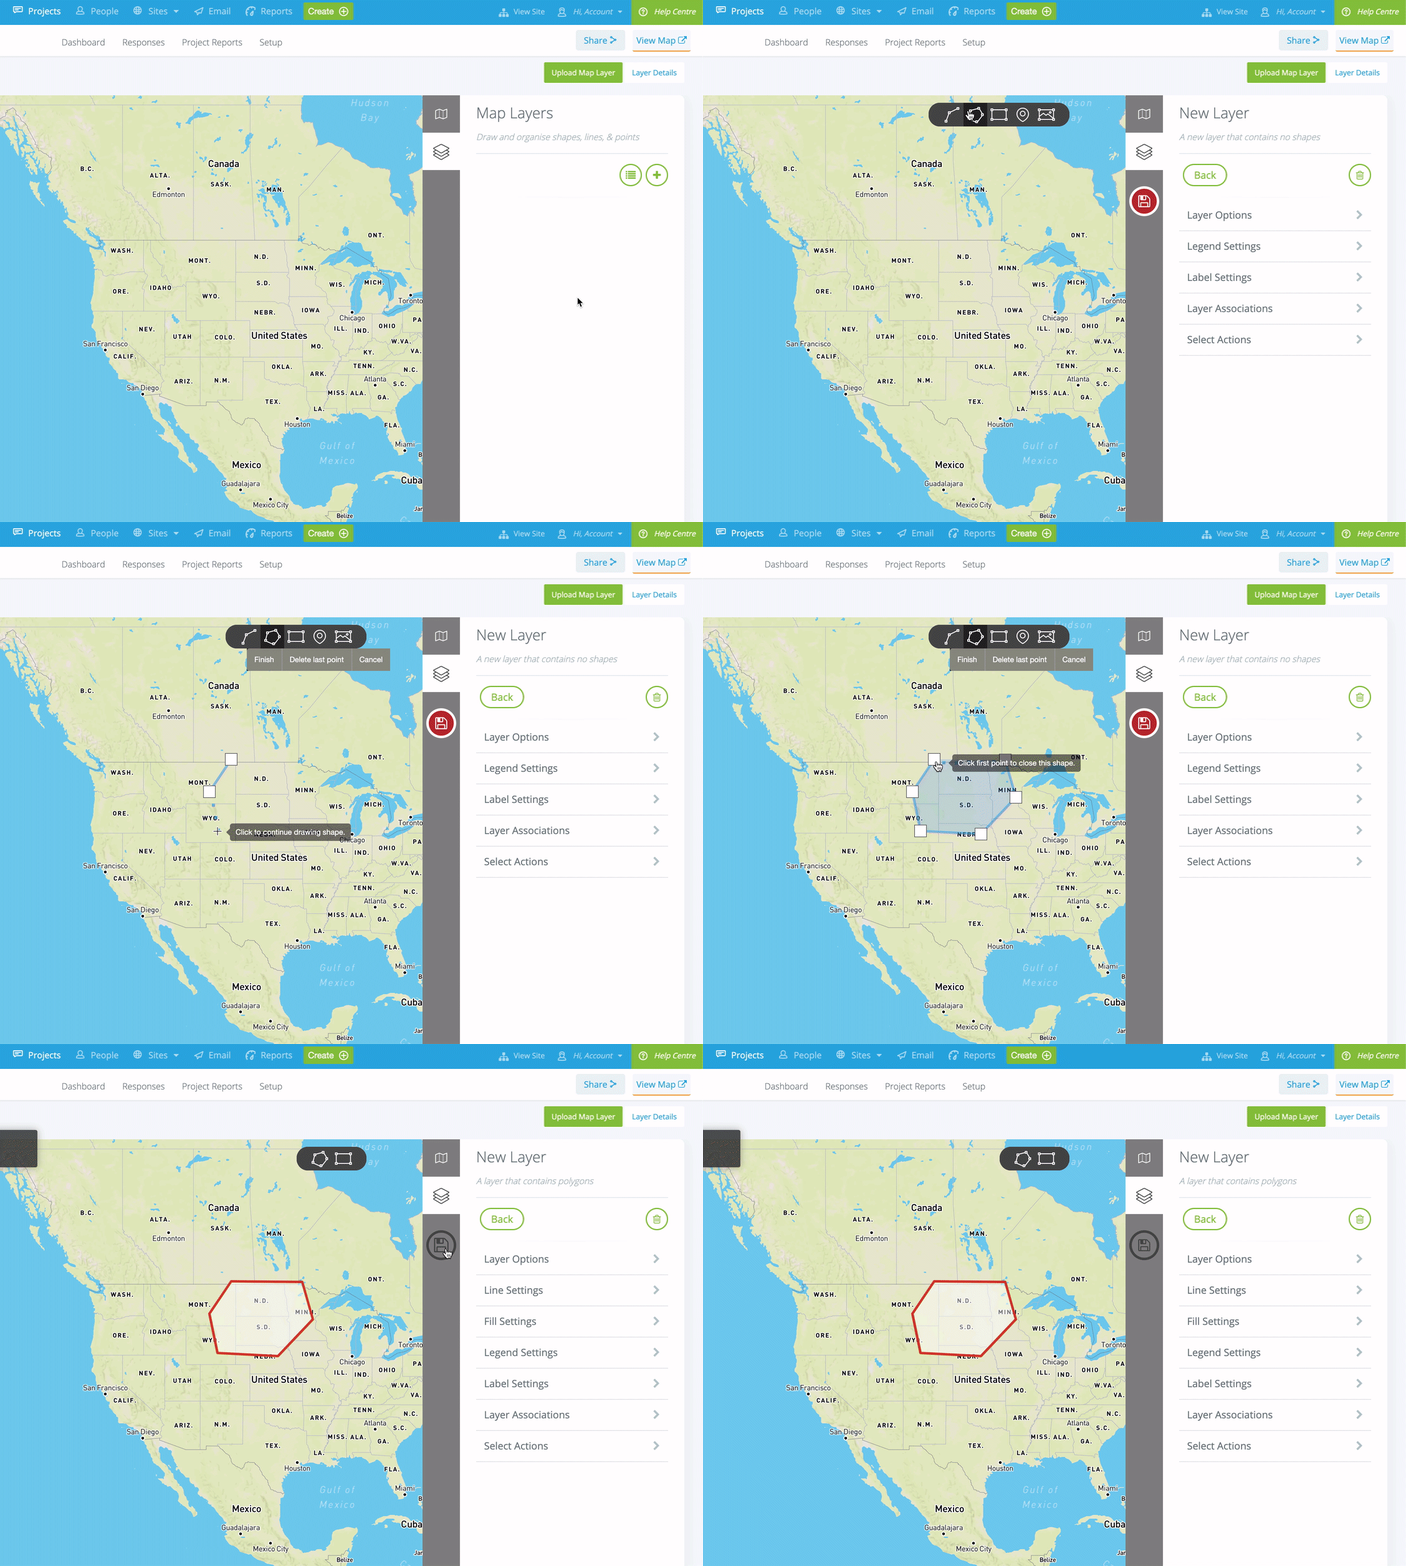
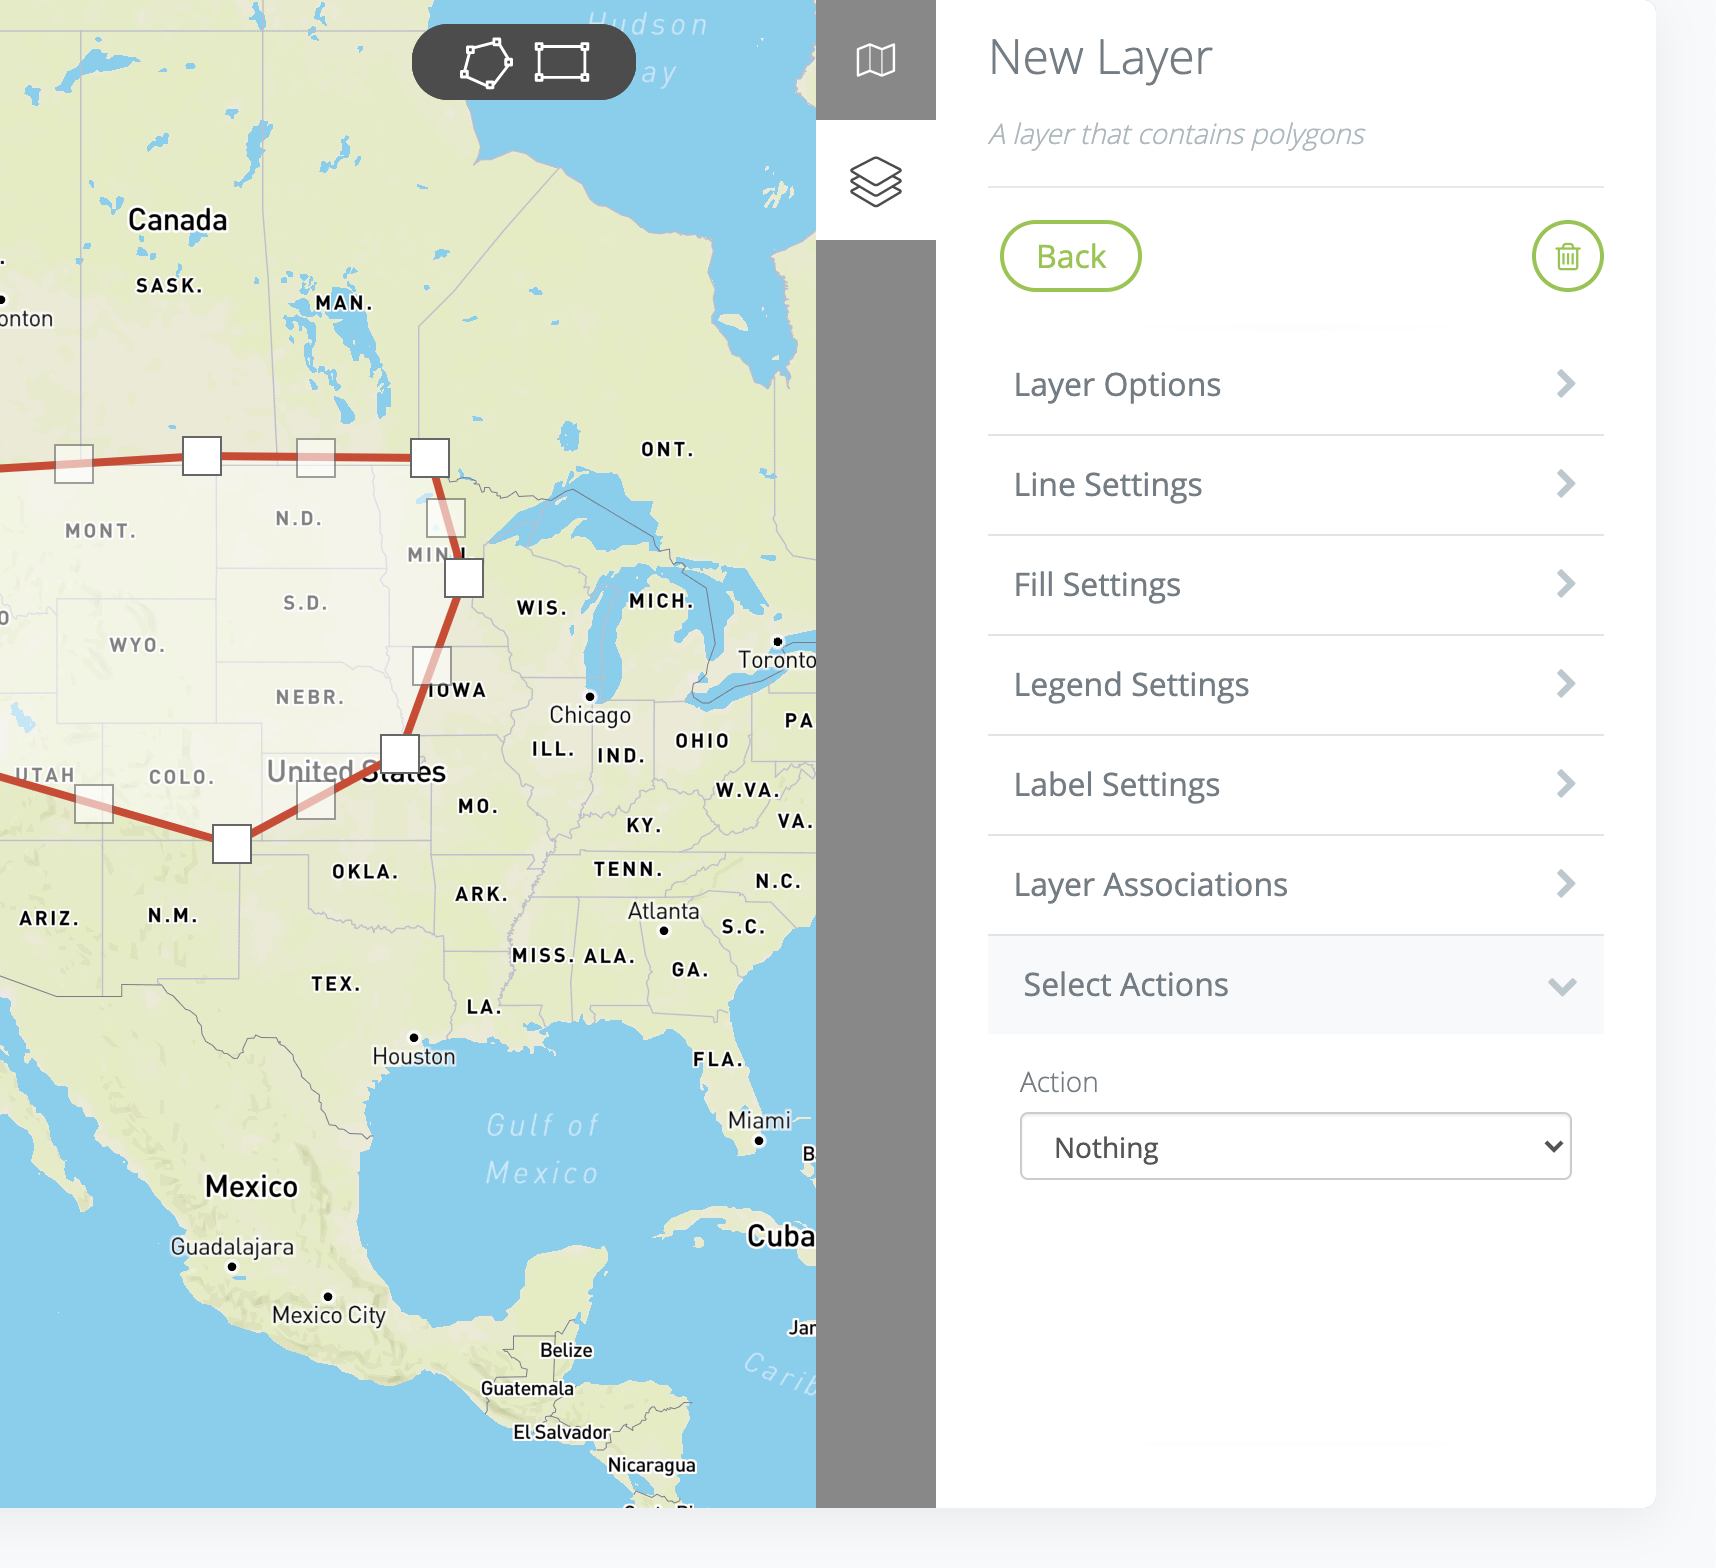
You can edit the shape by clicking on the shape you want to edit and dragging the opaque white squares
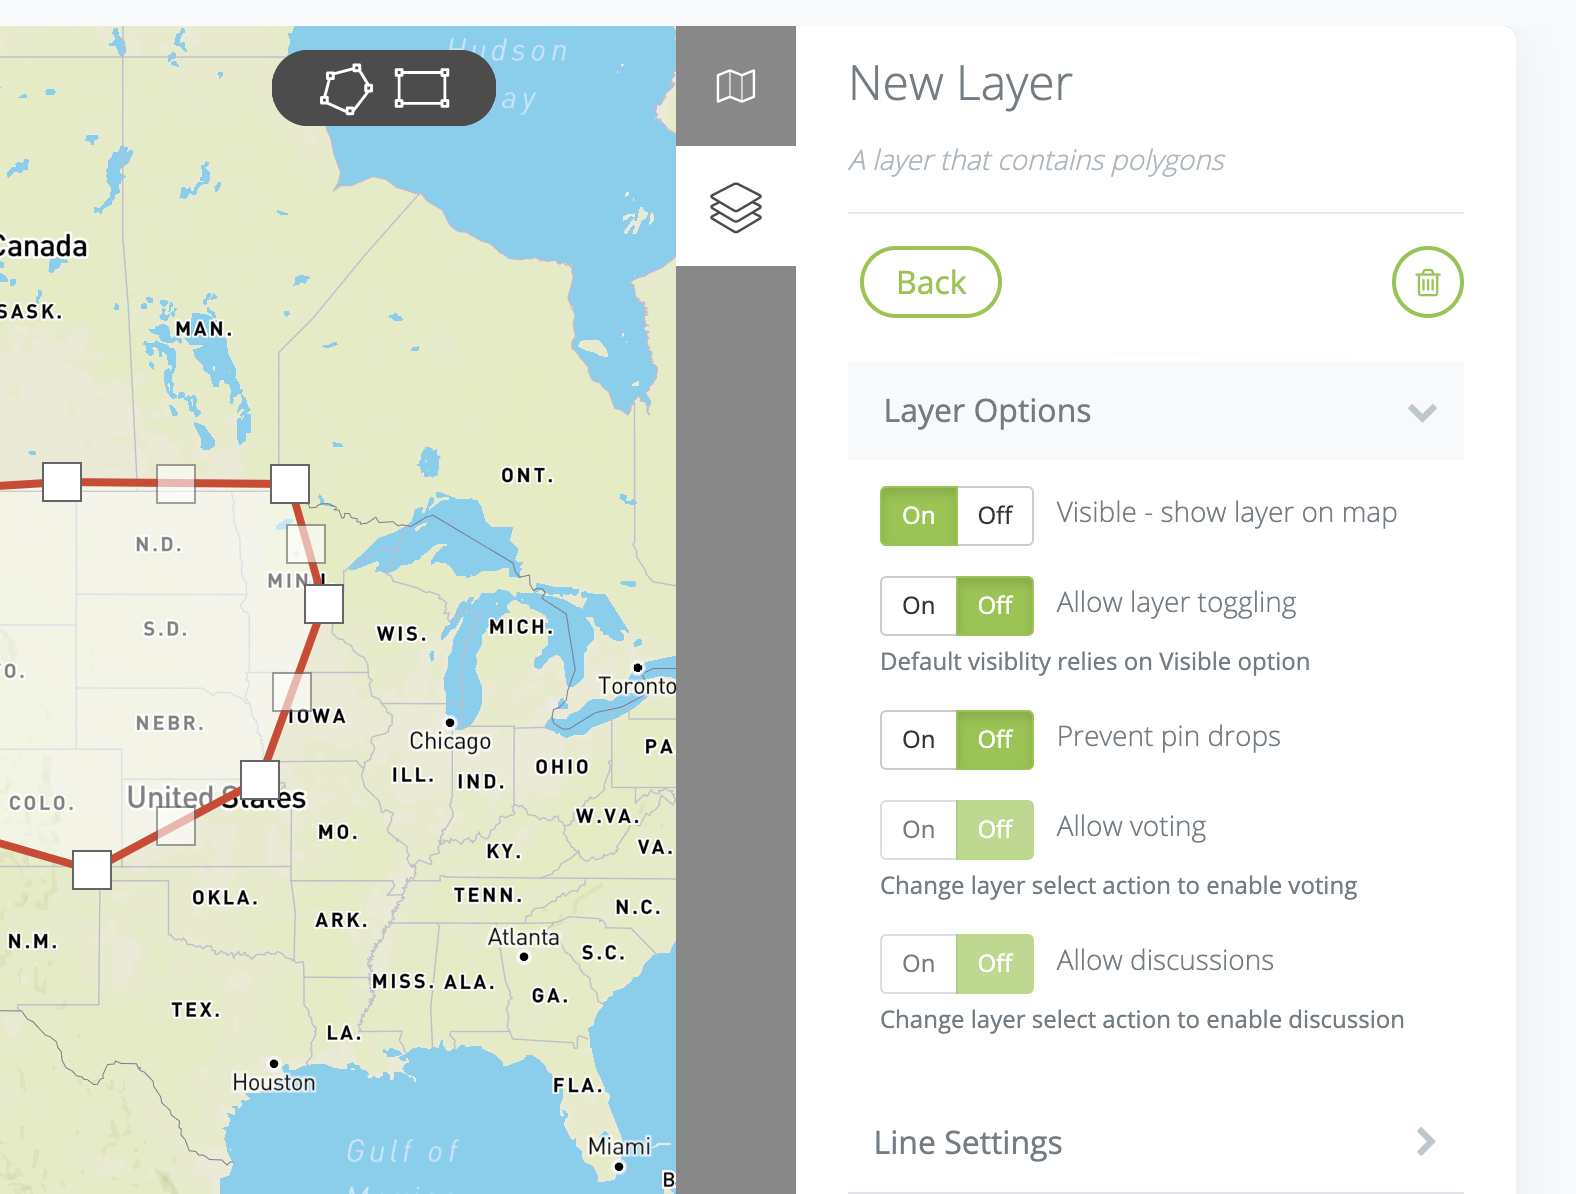
Layer Options
Visible: Will determine the visibility of the layer
Allow layer toggling: Will determine if stakeholders can toggle this layer on/off when viewing the map
Prevent Pin Drops: Determine if users can drop pins on this layer
Allow Voting: If a 'Select Action' is associated with this layer, you can enable stakeholders to like/dislike this layer
Allow discussions: If a 'Select Action' is associated with this layer, you can enable stakeholders to start a discussion on this layer
Enable Comments: Will determine if pins dropped on this layer will be labeled in reporting.
Associate with Stakeholders: Will determine if activity on this layer will be flagged to the users stakeholder record
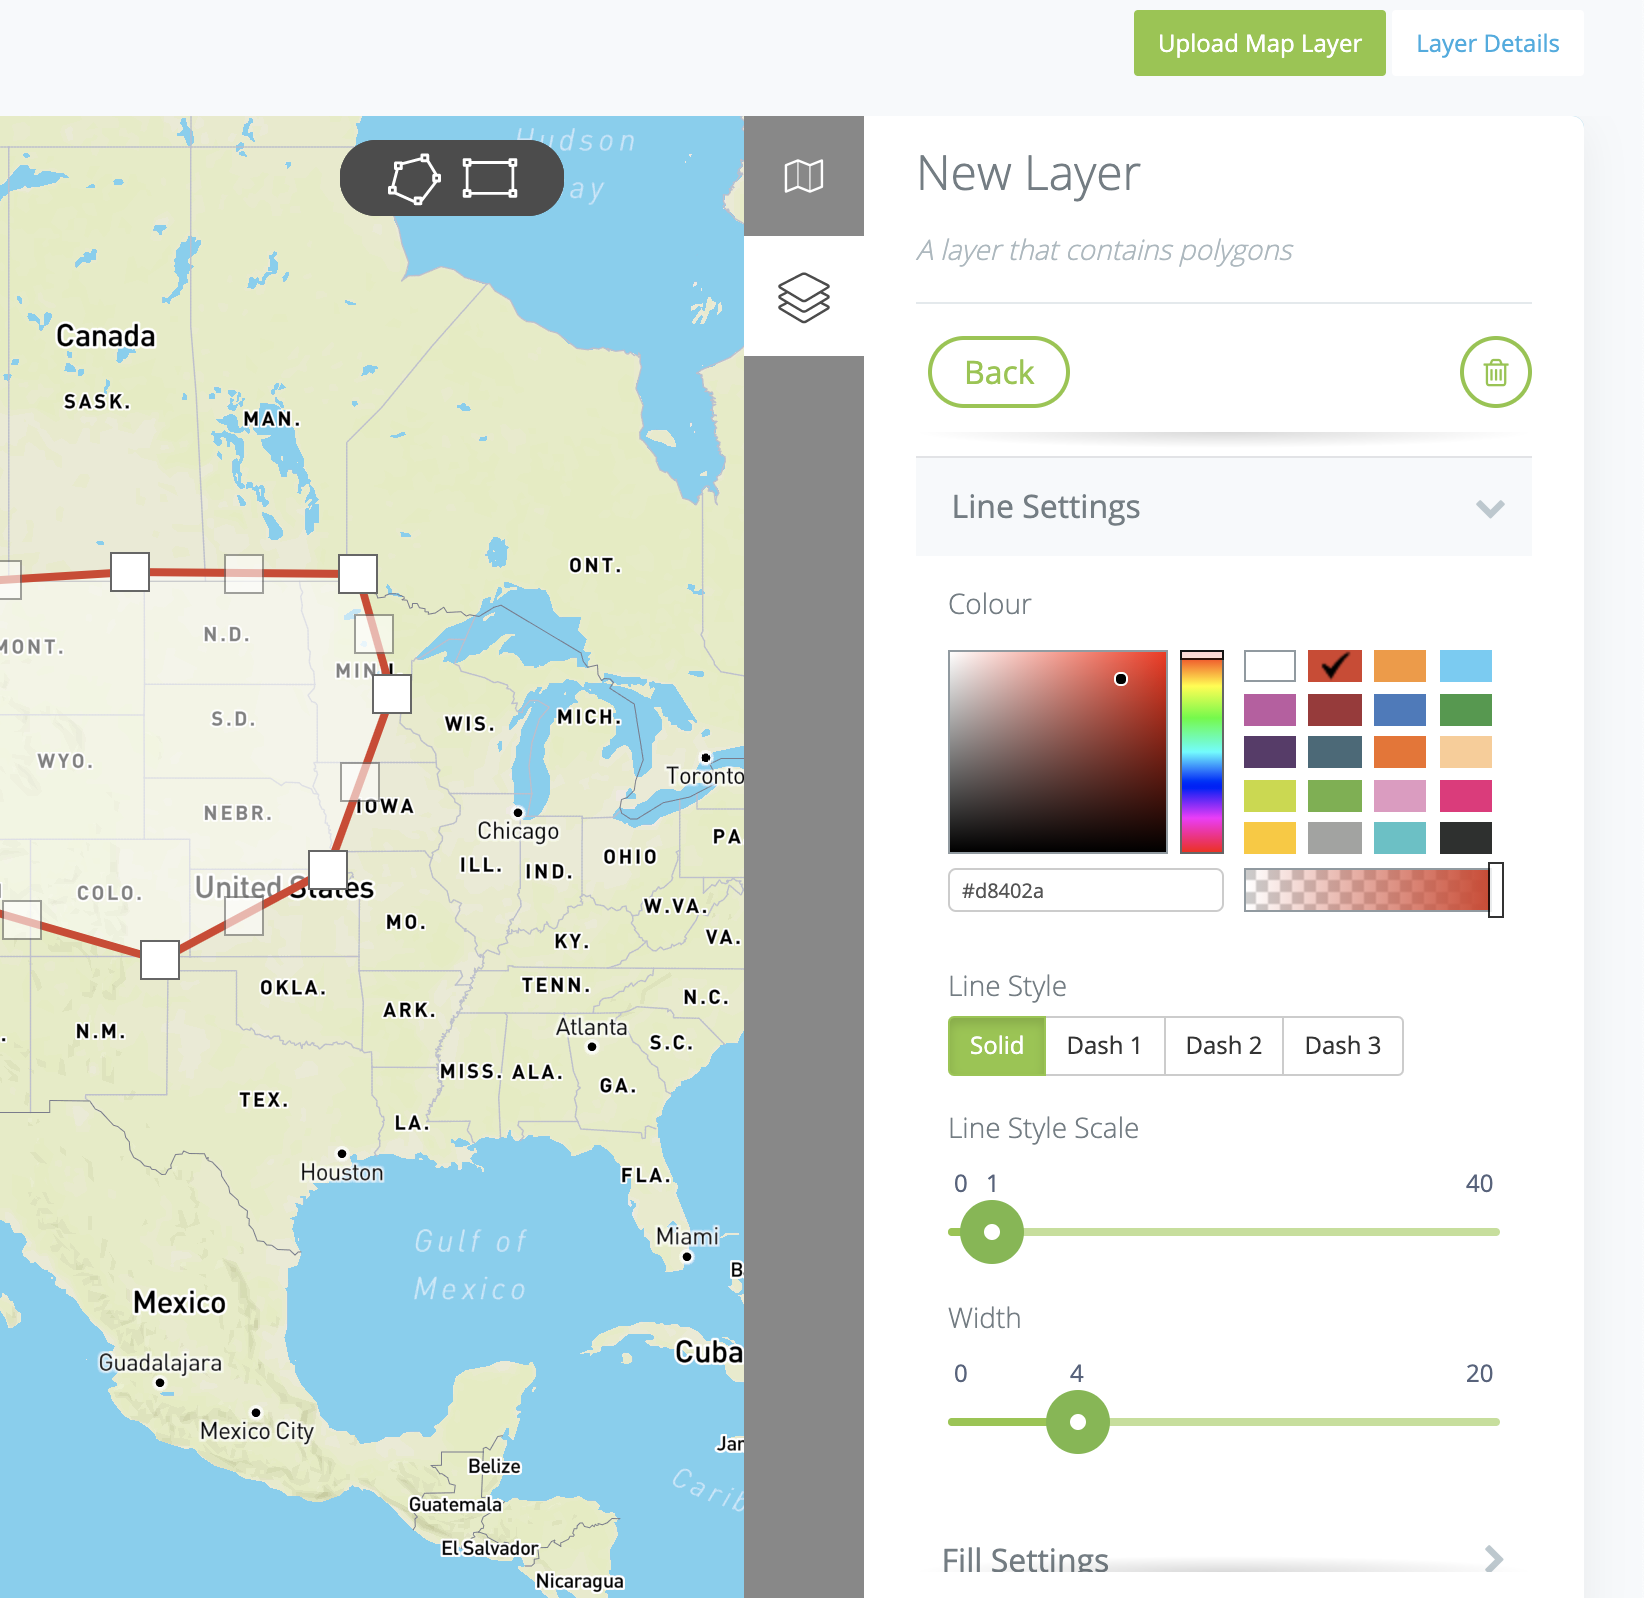
Line Settings
Line Colour: Choose a colour for the outline of the shape
Line Opacity: Change how transparent your layer is
Line Style: Choose between a solid line and three types of dashed lines.
Line Style Scale: Choose the length and space between the dashed lines.
Width: The higher the number the thicker the line (or dashed line).
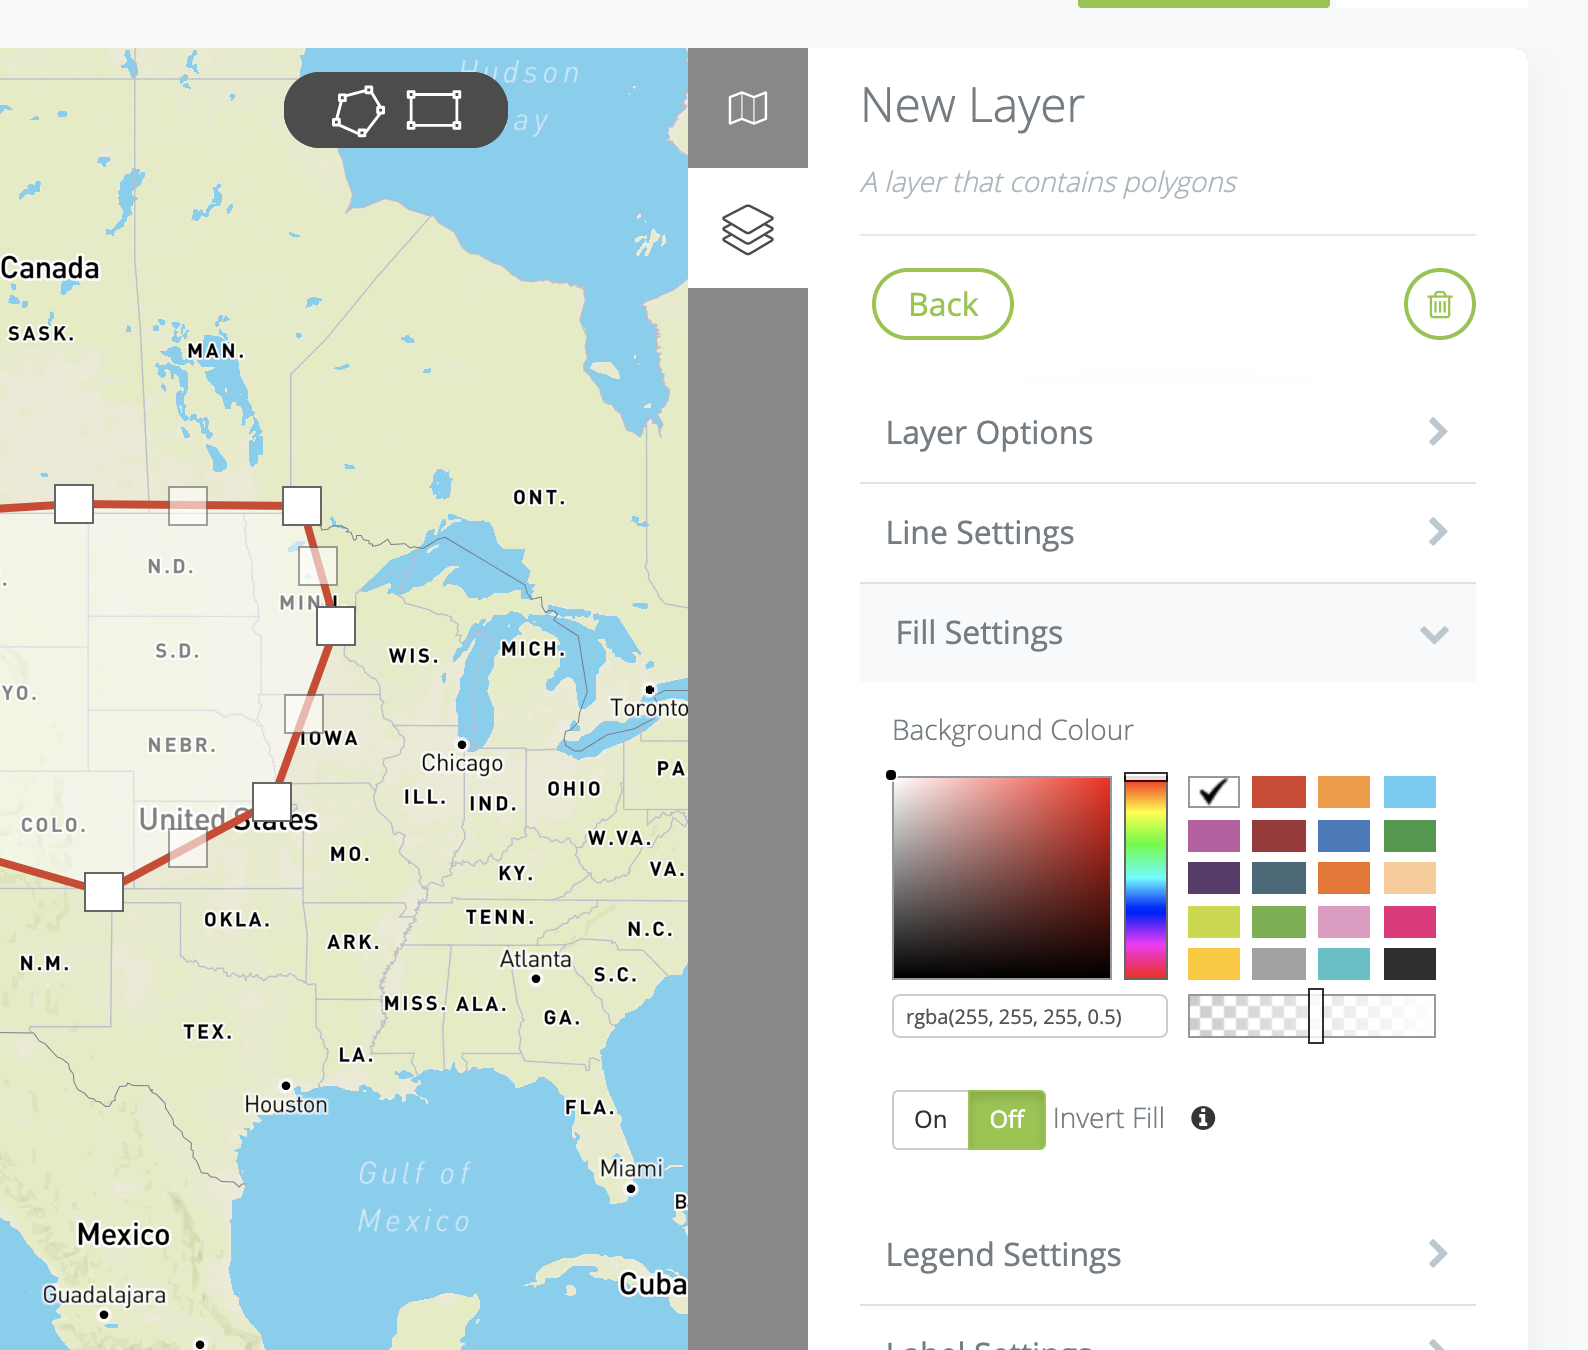
Fill Settings
Fill settings will only be visible for polygon layers
Background Colour: Set the hex value for the project area fill colour
Opacity: Change how transparent the inner area your layer is
Invert Fill: This allows you to color the area around the shape you have drawn
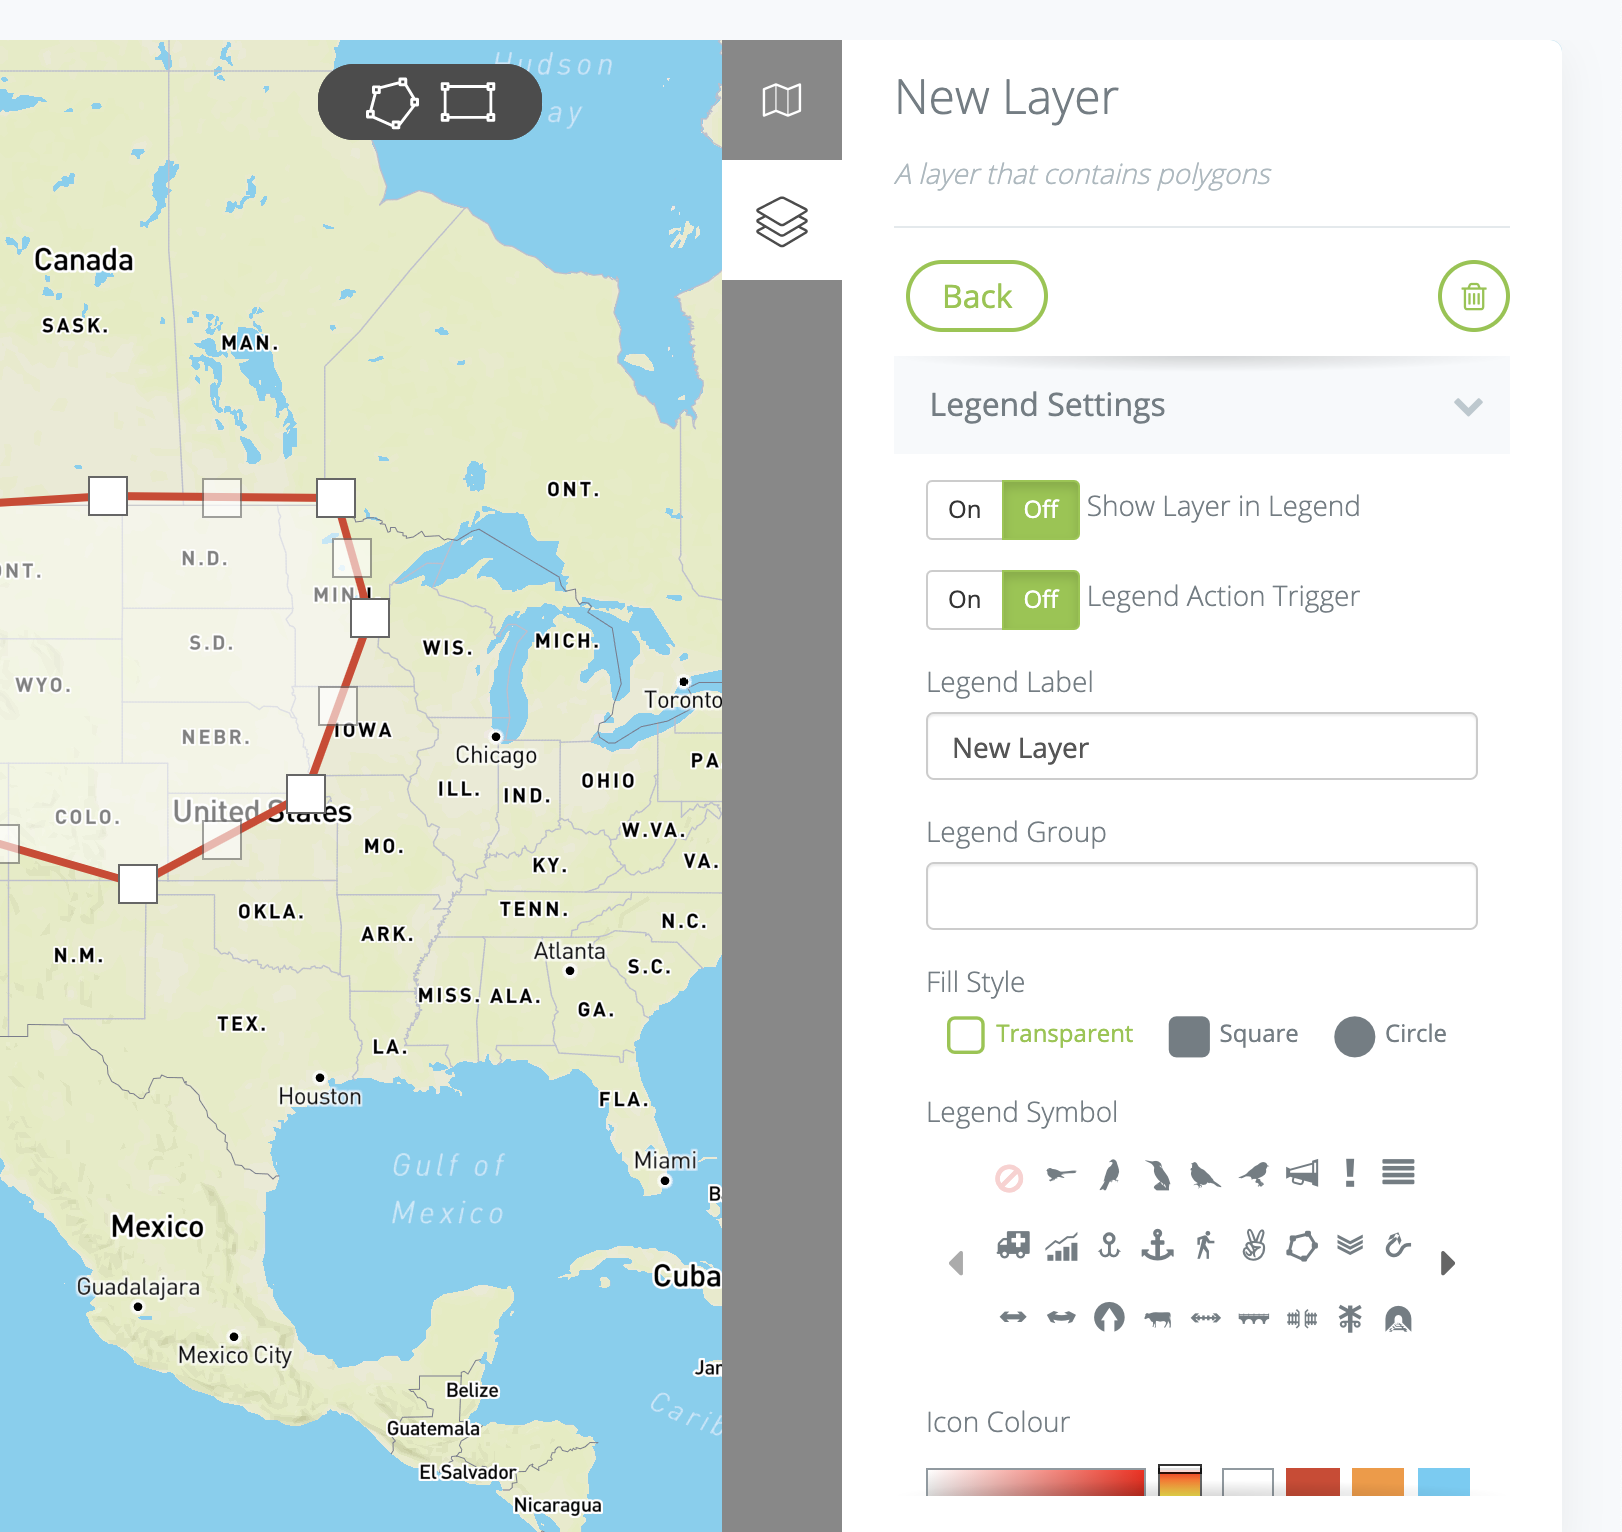
Legend Settings
Viewable in legend: show/hide layer name in the legend visible in the bottom right corner of the map
Legend Action Trigger: Clicking on this layer in the legend will trigger associated action
Legend Label - Used to give a different name to the layer in the legend. Defaults to layer name otherwise
Legend Group - group legend items
Fill Style - Choose between transparent, square or circle
Legend Symbol - Choose an icon. If you want a customize icon please contact us. (Note, may require upgrading subscription packages)
Legend Stroke Colour - select colour
Legend Fill Colour - select colour
Legend Fill Style - choose for transparent fill, circle or square
Legend Symbol Font - Choose a custom icon to be shown for the legend entry
Label Settings
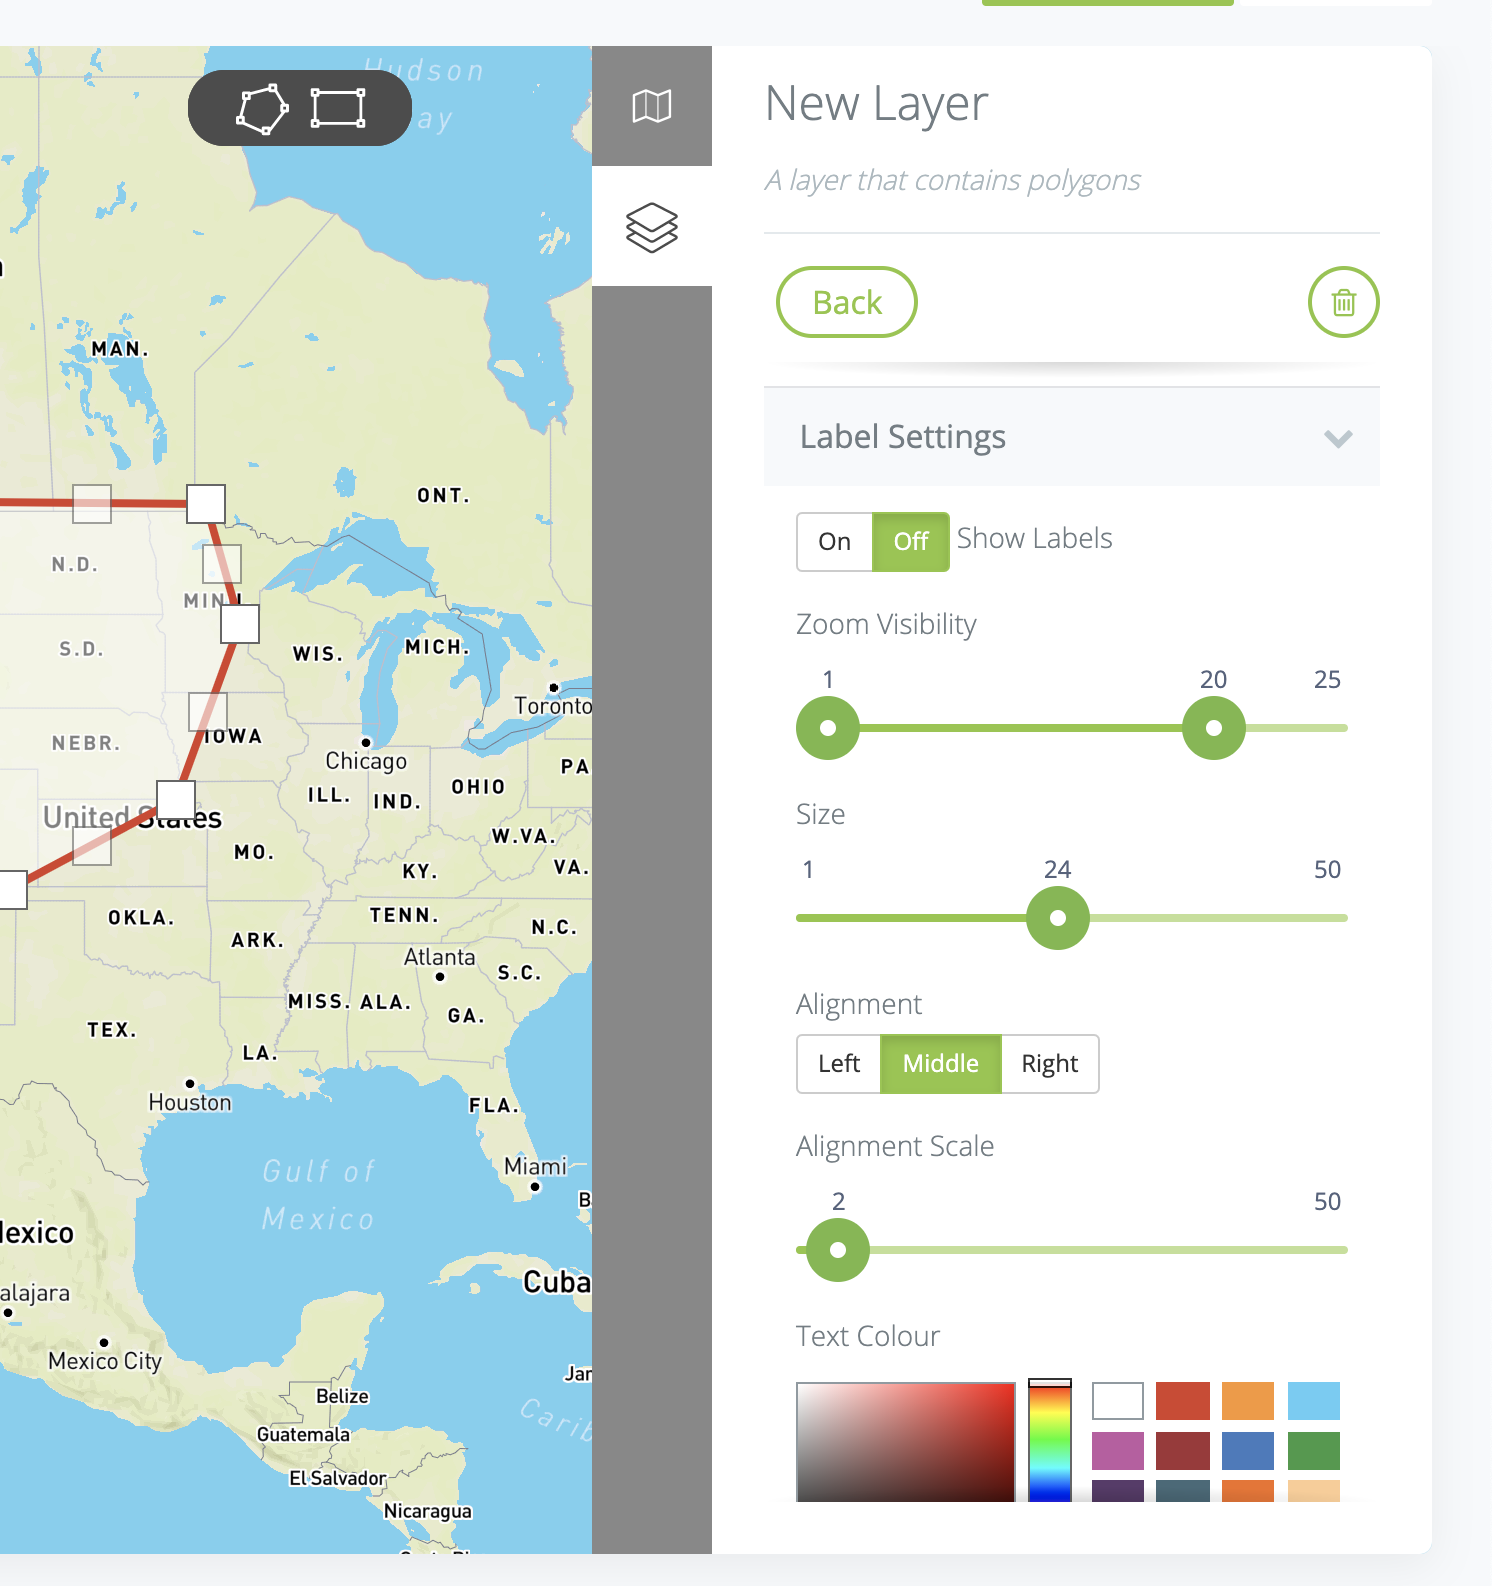
Labels can be shown for points or polygons within a layer/ Project Area. Select the 'View' option for an existing layer to show current NAME values associated with layer points or polygons.
Show Labels: If ticked the text contained in each point or polygon NAME value will be shown on the basemap.
Zoom visibility
Min Zoom (1): Minimum map zoom level at which the label is displayed
Max Zoom (25): Maximum map zoom level at which the label is displayed
Font Size: Sets the font size of the text label
Label font text colour: Use the colour picker to select the label text colour
Label stroke colour: Use the colour picker to select the stroke (border) colour
Label stroke weight: Set the width of the label stroke (border)
Label Alignment - Sets the position the label (middle, left, right)
Label Offset - Sets the default label position offset based on the alignment. Note this can be negative, eg Middle alignment, -20 offset puts the label above the point.
Layer Association
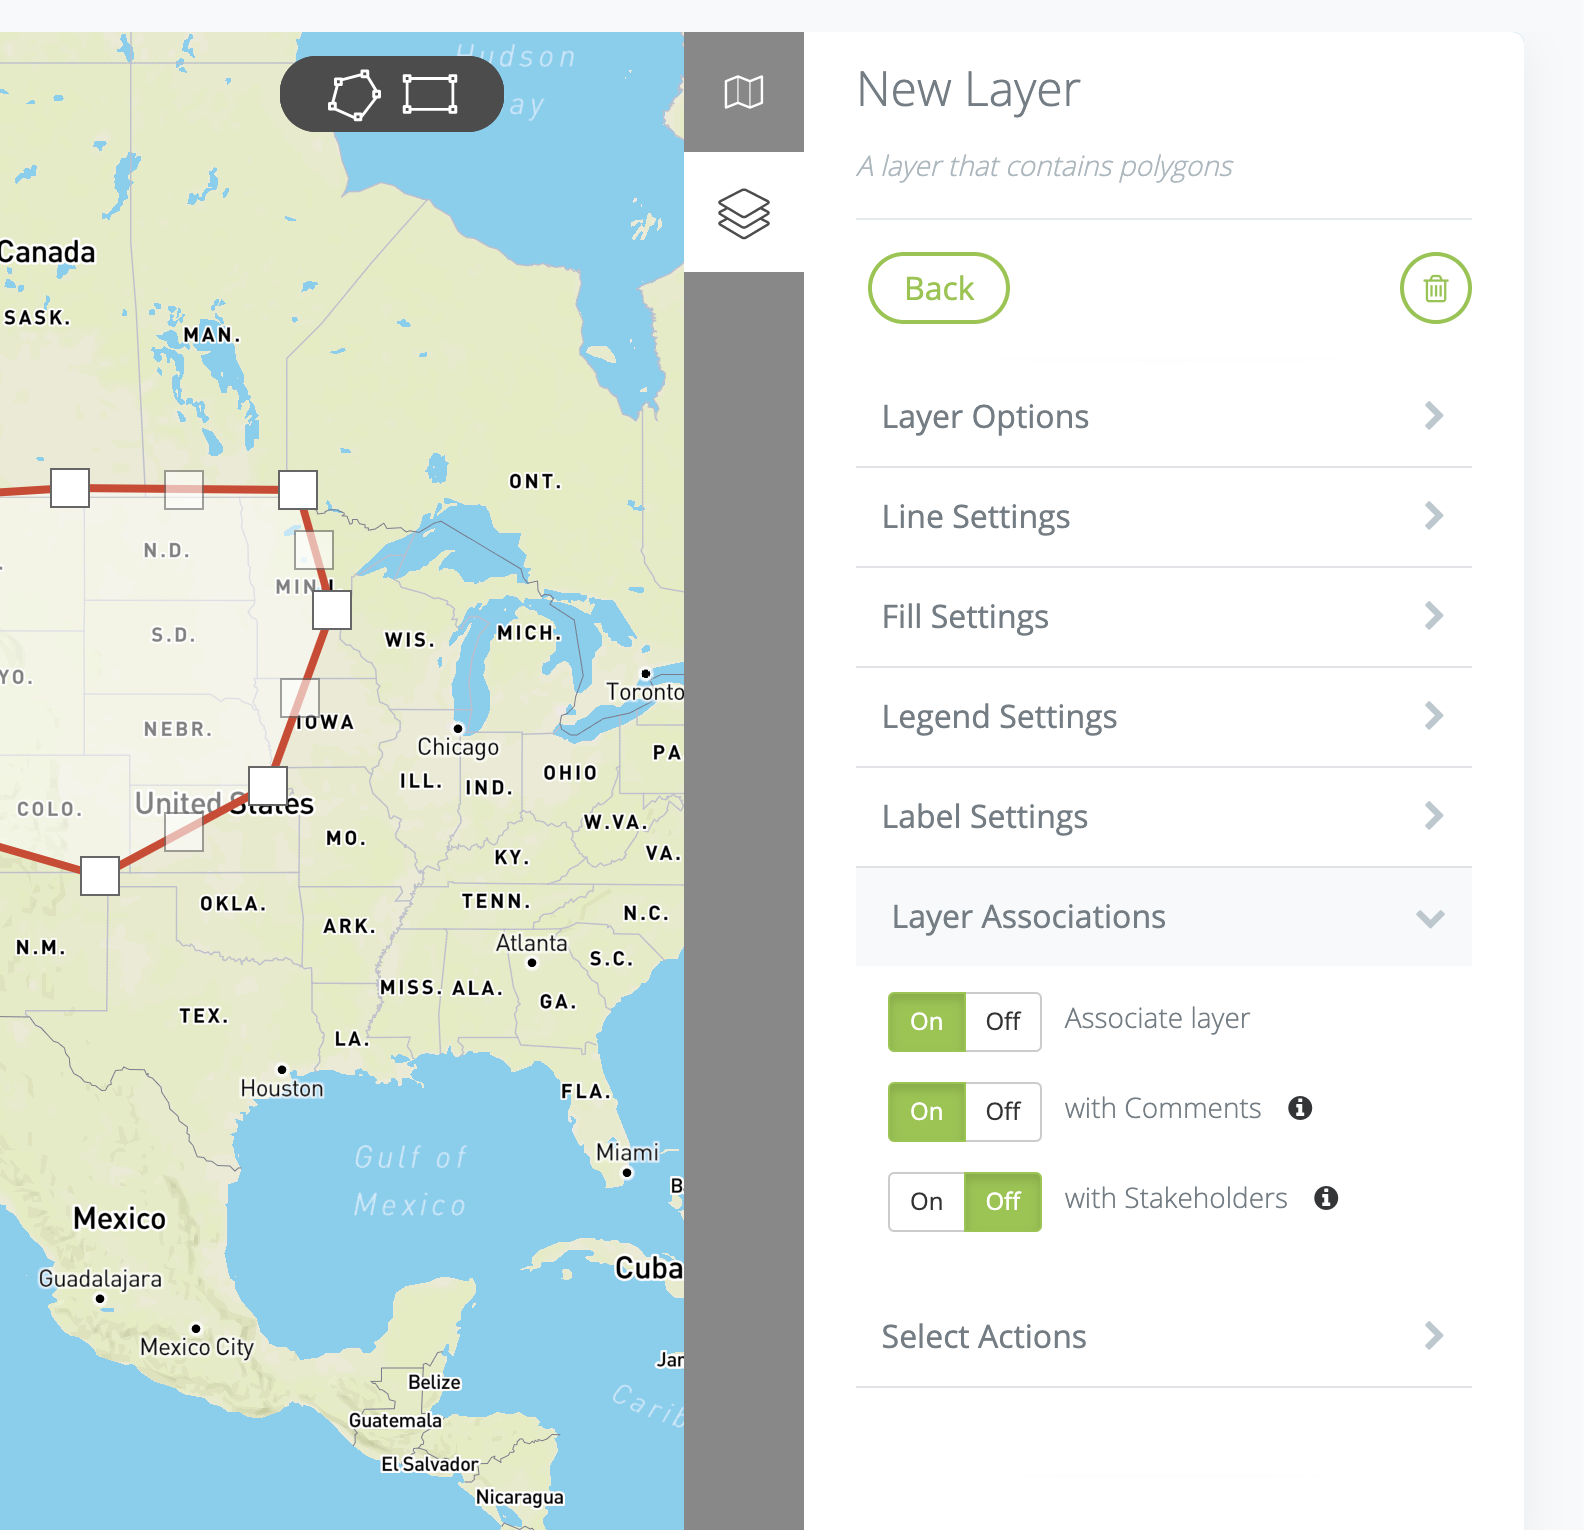
Advanced Settings: The default values here are typically suitable for most projects and often do not need to be changed
Associate Layer: This will allow you to associate stakeholder comments/details with this layer when they leave feedback on or within this layer
With Comments: When on, this will associate their comment with this layer
With Stakeholders: When on, this will associate the stakeholders information when leaving feedback on this layer
Select Actions
Select Actions - this option is used to set the action to execute if a user clicks on the layer. Options are:
-
Nothing
-
Open Information or Survey
-
Open Information and Zoom
-
Navigate to URL
-
Navigate to GeoSurvey step (if enabled for your subscription)
-
Open Sidebar
Nothing
Open Information or Survey
Open Information and Zoom
Navigate to URL
Navigate to GeoSurvey step (if enabled for your subscription)
Open Sidebar
